Interpolating values from a HEALPix map#
Main methods#
While all the functionality we have seen so far in the remainder of the documentation is concerned with the geometry of the HEALPix pixellization, the main purpose of HEALPix is to actually tabulate values in each pixel to represent a physical quantity over a sphere (e.g. flux over the celestial sphere). We will refer to this as a HEALPix map.
These maps are stored using a 1-dimensional vector with as many elements as pixels in the HEALPix pixellization, and either in the ‘ring’ or ‘nested’ order.
If you are interested in finding the value in a HEALPix map at a given longitude/latitude on the sphere, there are two main options:
Convert the longitude/latitude to the HEALPix pixel that the position falls inside (e.g.
index) usinglonlat_to_healpix()orskycoord_to_healpix(), and extract the value of the array of map values at that index (e.g.values[index]). This is essentially equivalent to a nearest-neighbour interpolation.Convert the longitude/latitude to the HEALPix pixel that the position falls inside then find the other neighboring pixels and carry out a bilinear interpolation. This is trickier to do by hand, and we therefore provide the methods
interpolate_bilinear_lonlat()andinterpolate_bilinear_skycoord()methods to facilitate this. If you are not already familiar with how to access HEALPix data from FITS files, we have provided a Full example in the following section.
Full example#
To illustrate this, we use an example map from the WMAP mission, specifically the map K Band Map for the Full Five Years. We start off by downloading and opening this map with Astropy:
>>> from astropy.io import fits
>>> hdulist = fits.open('https://lambda.gsfc.nasa.gov/data/map/dr3/skymaps/5yr//wmap_band_imap_r9_5yr_K_v3.fits')
>>> hdulist.info()
Filename: ...
No.    Name      Ver    Type      Cards   Dimensions   Format
  0  PRIMARY       1 PrimaryHDU      19   ()
  1  Archive Map Table    1 BinTableHDU     20   3145728R x 2C   [E, E]
Since HEALPix maps are stored in tabular form, the data is contained in HDU 1 (primary HDUs cannot contain tabular data).
Let’s now take a look at the header:
>>> hdulist[1].header
XTENSION= 'BINTABLE'           /binary table extension
BITPIX  =                    8 /8-bit bytes
NAXIS   =                    2 /2-dimensional binary table
NAXIS1  =                    8 /width of table in bytes
NAXIS2  =              3145728 /number of rows in table
PCOUNT  =                    0 /size of special data area
GCOUNT  =                    1 /one data group (required keyword)
TFIELDS =                    2 /number of fields in each row
TTYPE1  = 'TEMPERATURE '       /label for field 1
TFORM1  = 'E       '           /data format of field: 4-byte REAL
TUNIT1  = 'mK      '           /physical unit of field 1
TTYPE2  = 'N_OBS   '           /label for field 2
TFORM2  = 'E       '           /data format of field: 4-byte REAL
TUNIT2  = 'counts  '           /physical unit of field 2
EXTNAME = 'Archive Map Table'  /name of this binary table extension
PIXTYPE = 'HEALPIX '           /Pixel algorigthm
ORDERING= 'NESTED  '           /Ordering scheme
NSIDE   =                  512 /Resolution parameter
FIRSTPIX=                    0 /First pixel (0 based)
LASTPIX =              3145727 /Last pixel (0 based)
Of particular interest to us are the NSIDE and ORDERING keywords:
>>> hdulist[1].header['NSIDE']
512
>>> hdulist[1].header['ORDERING']
'NESTED'
The data itself can be accessed using:
>>> hdulist[1].data['TEMPERATURE']
array([ 16.285   ,  16.802532,  15.320368, ...,  15.07802 ,  15.362292,
        15.232816], dtype=float32)
The last piece of information we need is that the map is in Galactic coordinates, which is unfortunately not encoded in the header but can be found here.
We can now instantiate a HEALPix object:
>>> from astropy_healpix import HEALPix
>>> from astropy.coordinates import Galactic
>>> nside = hdulist[1].header['NSIDE']
>>> order = hdulist[1].header['ORDERING']
>>> hp = HEALPix(nside=nside, order=order, frame=Galactic())
and we can now use
interpolate_bilinear_skycoord() to interpolate
the temperature at a given position on the sky:
>>> from astropy.coordinates import SkyCoord
>>> coord = SkyCoord('00h42m44.3503s +41d16m08.634s', frame='icrs')
>>> temperature = hdulist[1].data['temperature']
>>> hp.interpolate_bilinear_skycoord(coord, temperature)
0.40692833017361985
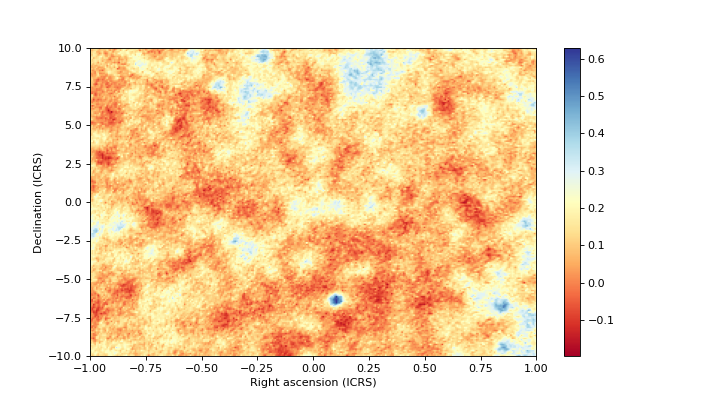
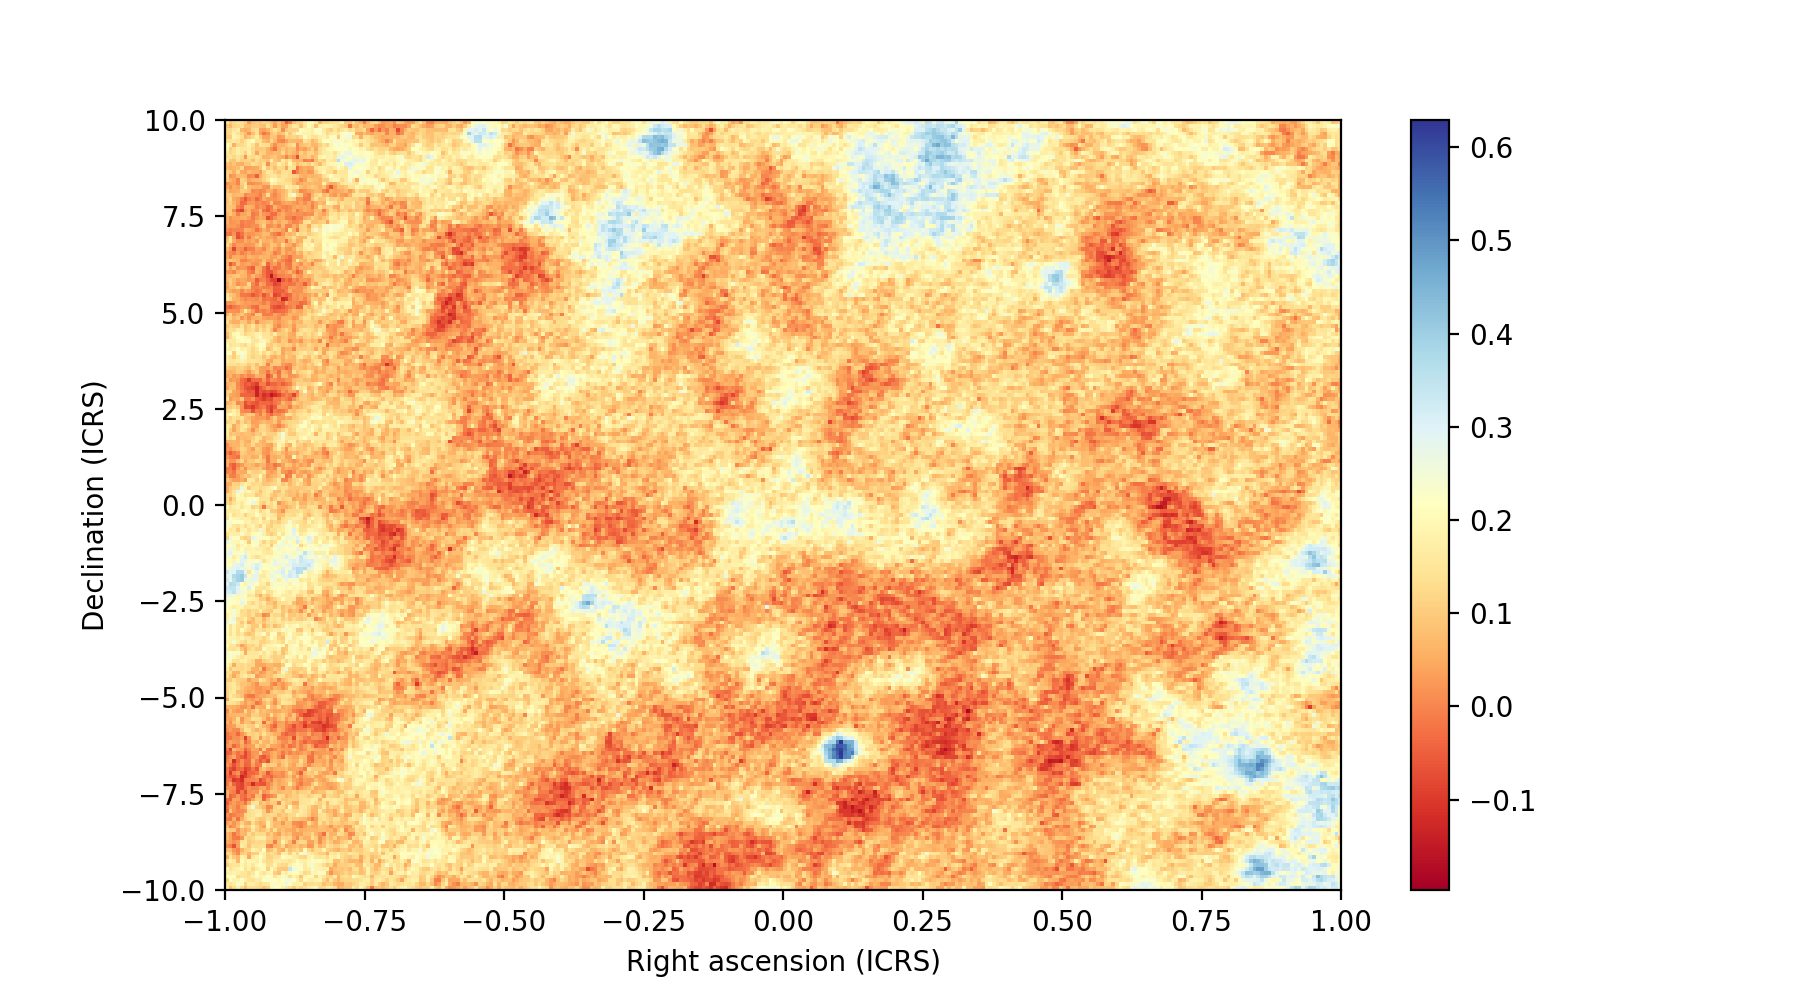
Here is a full example that uses this to make a map of a section of the sky:
# Get the data
from astropy.io import fits
hdulist = fits.open('https://lambda.gsfc.nasa.gov/data/map/dr3/skymaps/5yr//wmap_band_imap_r9_5yr_K_v3.fits')

# Set up the HEALPix projection
from astropy_healpix import HEALPix
from astropy.coordinates import Galactic
nside = hdulist[1].header['NSIDE']
order = hdulist[1].header['ORDERING']
hp = HEALPix(nside=nside, order=order, frame=Galactic())

# Sample a 300x200 grid in RA/Dec
from astropy import units as u
ra = np.linspace(-15., 15., 300) * u.deg
dec = np.linspace(-10., 10., 200) * u.deg
ra_grid, dec_grid = np.meshgrid(ra, dec)

# Set up Astropy coordinate objects
from astropy.coordinates import SkyCoord
coords = SkyCoord(ra_grid.ravel(), dec_grid.ravel(), frame='icrs')

# Interpolate values
temperature = hdulist[1].data['temperature']
tmap = hp.interpolate_bilinear_skycoord(coords, temperature)
tmap = tmap.reshape((200, 300))

# Make a plot of the interpolated temperatures
plt.figure(figsize=(9, 5))
im = plt.imshow(tmap, extent=[-1, 1, -10, 10], cmap=plt.cm.RdYlBu, origin='lower', aspect='auto')
plt.colorbar(im)
plt.xlabel('Right ascension (ICRS)')
plt.ylabel('Declination (ICRS)')
plt.show()
(Source code, png, hires.png, pdf)

In practice, for the common case of reprojecting a HEALPix map to a regular gridded image, you can use the reproject package which provides high-level reprojection functions that use healpix behind the scenes.